 ENVI-Met Grid - [source code]
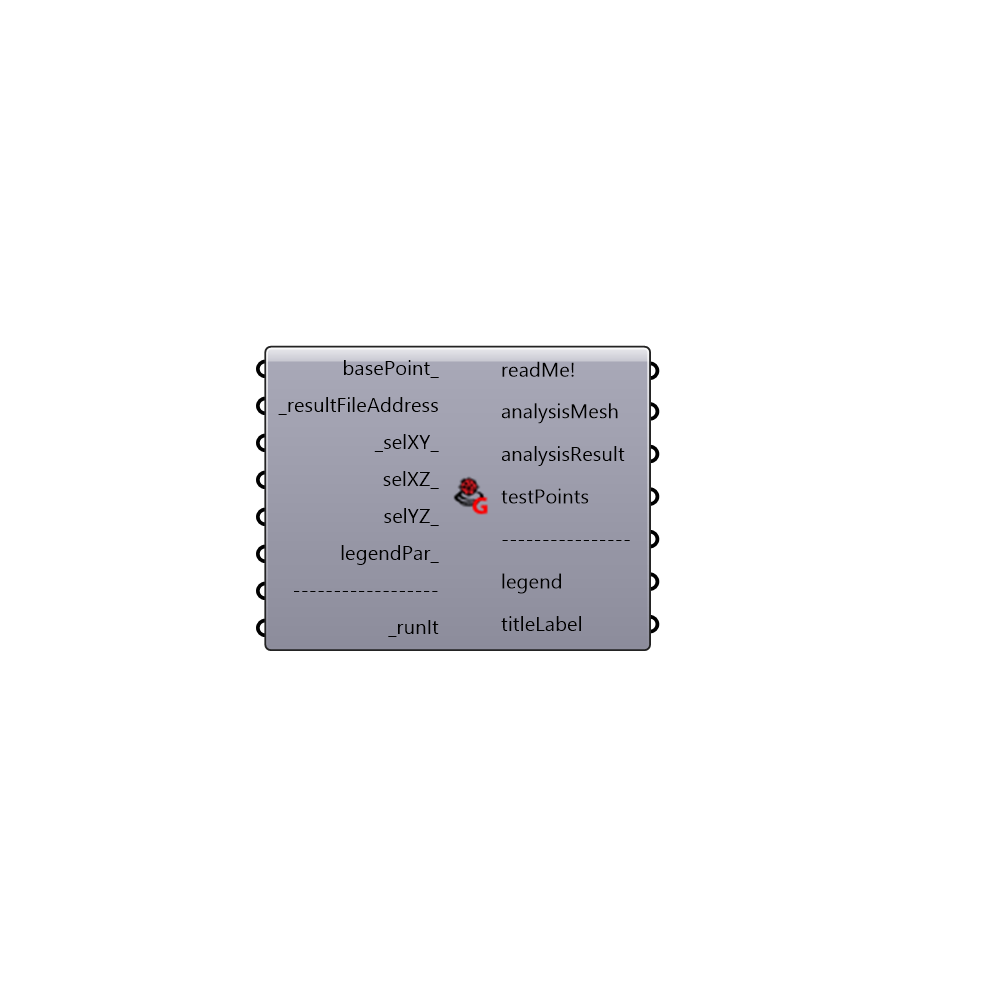
Use this component to visualize ENVI-Met v4.0 data. Connect "resultFileAddress" which comes from ENVI-Met reader. - Component mainly based on: https://www.researchgate.net/publication/281031049_Outdoor_Comfort_the_ENVI-BUG_tool_to_evaluate_PMV_values_point_by_point -
Inputs
basePoint [Optional]
Input a point here to move ENVI-Met grid. If no input is provided it will be origin point.resultFileAddress [Required]
Output comes from "ENVI-Met Reader".selXY [Default]
Connect an integer to generate a XY section. Plug a panel to "readMe!" for more info. - Default value is 0.selXZ [Optional]
Connect an integer to generate a XZ section. Plug a panel to "readMe!" for more info.selYZ [Optional]
Connect an integer to generate a YZ section. Plug a panel to "readMe!" for more info.legendPar [Optional]
Optional legend parameters from the Ladybug Legend Parameters component.runIt [Required]
Set to "True" to run the component and perform ENVI-Met data visualization.
Outputs
readMe!
...analysisMesh
Analysis grid of ENVI-Met (XY plane, ZX plane and ZY plane).analysisResult
Values corrisponding to each analysis Grid.testPoints
Test points on grids.legend
Legend geometry of ENVI-Met Grid.titleLabel
Title geometry with information about project name, location, and date.