 Countour Mesh - [source code]
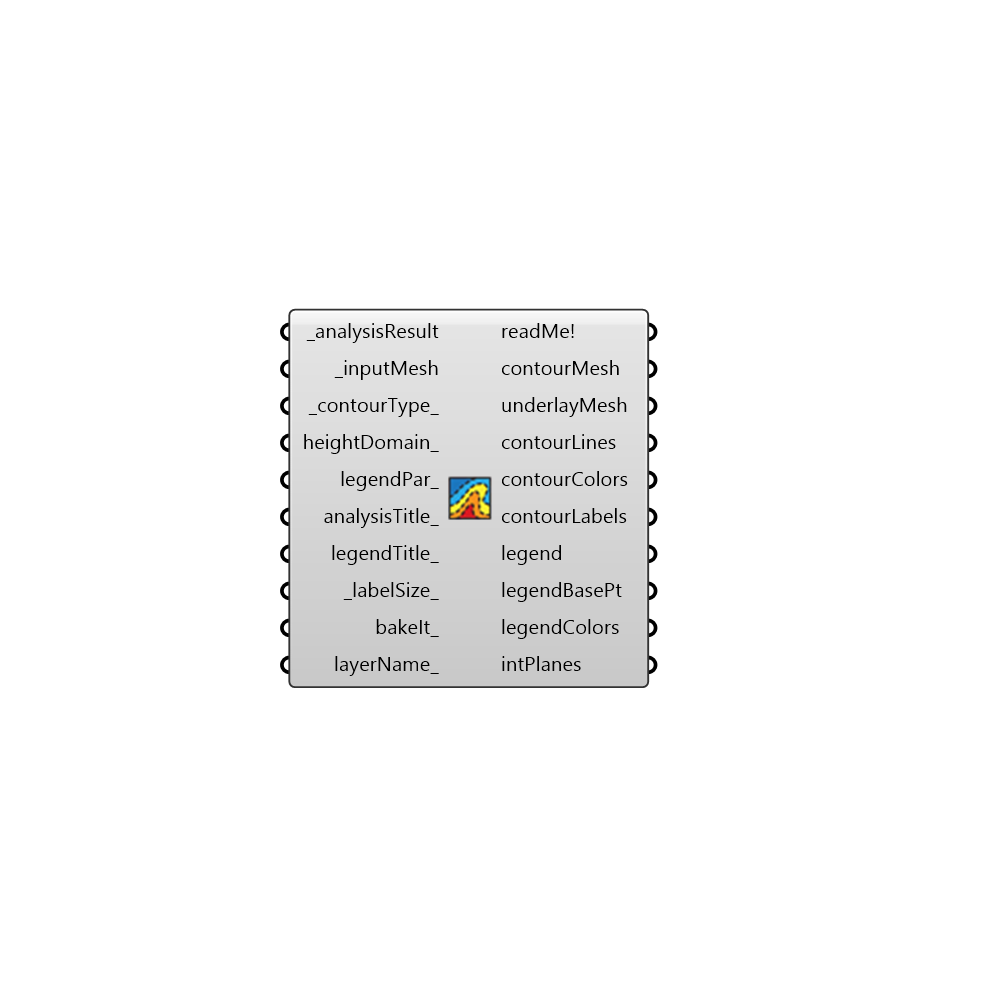
Use this component to create contoured visualizations of any analysis mesh and corresponding numerical dataset in Ladybug + Honeybee. Note that this component currently only works for planar meshes. -
Inputs
analysisResult [Required]
A numerical data set whose length corresponds to the number of faces in the _inputMesh. This data will be used to generate contours from the mesh.inputMesh [Required]
An already-colored mesh from one of the Ladybug components which you would like to re-color based on data in the _analysisResult.contourType [Default]
An integer to set the type of contour visualization. The default is set to 0 for colored regions. Choose from the following options: 0 - Colored Regions + Labeled Lines 1 - Colored Regions 2 - Labeled Lines 3 - Colored LinesheightDomain [Optional]
Optional height domain to create a 3D mesh result. Use Construct Domain component to create a domainlegendPar [Optional]
Optional legend parameters from the Ladybug Legend Parameters component. Legend Parameters can be used to change the colors, numerical range, and/or number of divisions of any Ladybug legend along with the corresponding colored mesh.analysisTitle [Optional]
Text representing a new title for the re-colored mesh. If no title is input here, the default will read "unnamed."legendTitle [Optional]
Text representing a new legend title for re-colored mesh. Legends are usually titled with the units of the _analysisResult. If no text is provided here, the default title will read "unkown units."labelSize [Default]
A number to set the size of the text labels for the contours when contourType 0 or 2 is selected. The default is auto-calculated based on the size of the mesh.bakeIt [Optional]
An integer that tells the component if/how to bake the bojects in the Rhino scene. The default is set to 0. Choose from the following options: 0 (or False) - No geometry will be baked into the Rhino scene (this is the default). 1 (or True) - The geometry will be baked into the Rhino scene as a colored hatch and Rhino text objects, which facilitates easy export to PDF or vector-editing programs. 2 - The geometry will be baked into the Rhino scene as colored meshes, which is useful for recording the results of paramteric runs as light Rhino geometry.layerName [Optional]
If bakeIt_ is set to "True", input Text here corresponding to the Rhino layer onto which the resulting mesh and legend should be baked.
Outputs
readMe!
...contourMesh
A list of colored meshes that is organized with each contour region as its own color.underlayMesh
A mesh that is colored face-by-face (like a typical Ladybug mesh), which is plaed under the contour mesh to make the visualization read when the Rhino intersection fails to produce a complete contourMesh.contourLines
Curves that show values of constant value along the results.contourColors
Connect these to a native Grasshopper Preview componen along with the contourLines to get a colored line visualization.contourLabels
A list of text meshes that show the value along each contour line.legend
A new legend that that corresponds to the colors of the newMesh. Connect this output to a grasshopper "Geo" component in order to preview this legend separately in the Rhino scene.legendBasePt
The legend base point, which can be used to move the legend in relation to the newMesh with the grasshopper "move" component.legendColors
A list of colors that correspond to each step in the legend.intPlanes
The planes that were used to intersect the mesh to genrate the contours. Set heightDomain_ to a non-zer number to visualize.