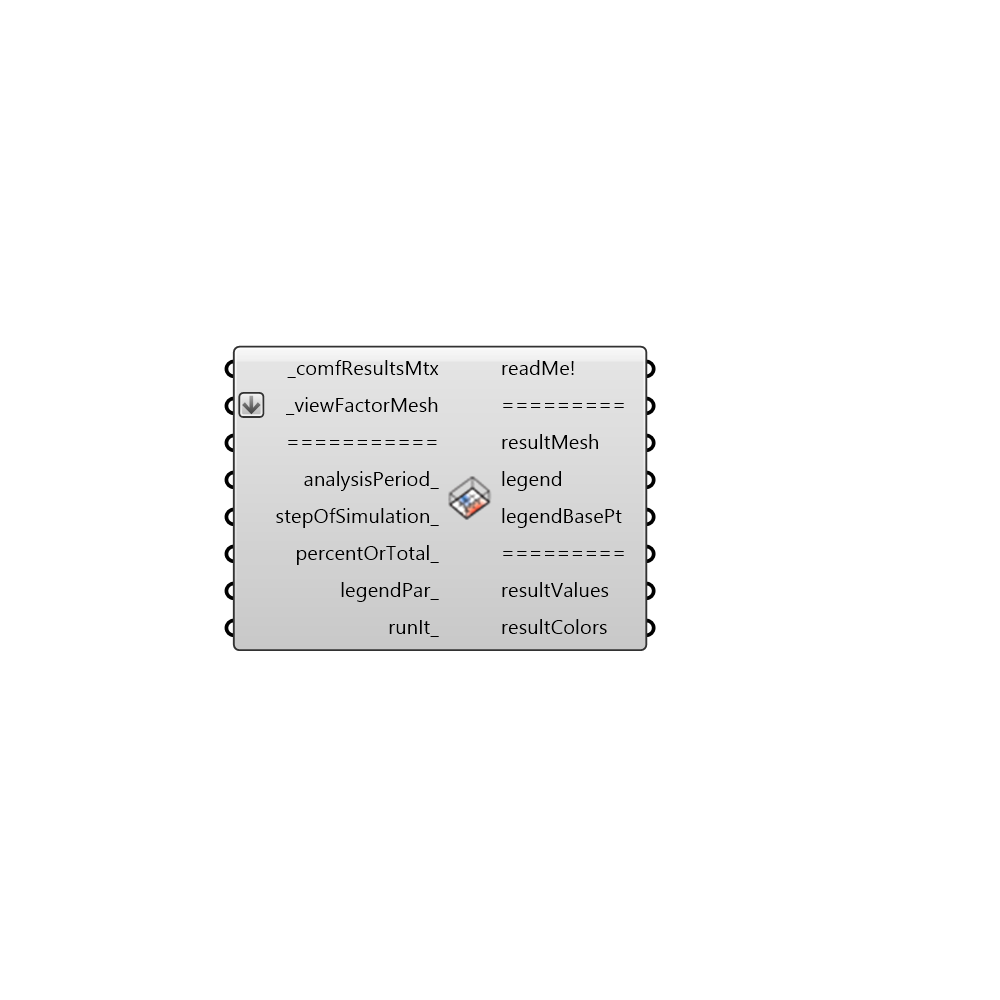
 Visualize Microclimate Map - [source code]

Use this component to produce a colored mesh from a comfResultsMtx. -
Inputs
comfResultsMtx [Required]
Any matrix output from the 'Honeybee_Microclimate Map Analysis' component, the 'Honeybee_Thermal Comfort Autonomy Analysis' component, or the 'Honeybee_Read Microclimate Matrix' component.viewFactorMesh [Required]
The list of view factor meshes that comes out of the 'Honeybee_Indoor View Factor Calculator'. These will be colored with result data.analysisPeriod [Optional]
Optional analysisPeriod to take a slice out of the data stream. Note that that connecting a value to 'stepOfSimulation' will override this input.stepOfSimulation [Optional]
Optional interger to select out a step of the simulation to color the mesh with. Connecting a value here will override the analysisPeriod_ input.percentOrTotal [Optional]
Set to 'True' to have the component compute comfort values as a percent of occupied hours or all hours. Set to 'False' to have the component compute comfort values as a total number of hours. The default is set to 'True' to calculate comfort as a percent. Note that this input only works for comfort matrices and not temperature ones.legendPar [Optional]
Optional legend parameters from the Ladybug Legend Parameters component.runIt [Optional]
Set boolean to "True" to run the component and produce a colored mesh from a comfResultsMtx.
Outputs
readMe!
...resultMesh
A list of colored meshes showing the results form the comfResultsMtx.legend
A legend for the colored mesh. Connect this output to a grasshopper "Geo" component in order to preview the legend spearately in the Rhino scene.legendBasePt
The legend base point, which can be used to move the legend with the grasshopper "move" component.resultValues
The values of results that are being used to color the results.resultColors
The colors used for each mesh face.